Custom sorting with DT
I came across a practical case a couple of days ago where the row and column ordering provided out of the box by the R DT package was not enough.
The DT package provides a wrapper around the DataTable javascript library powered by jQuery. DT can be used in Rmarkdown documents as well as in Shiny.
The goal was to display a table containing columns reporting the bandwidth consumption for some sites.
The bandwidth is expressed in bits per second (bps). When quantifying large bit rates, decimal prefixes are used. For example:
- 1,000 bps = 1 Kbps (one kilobit or one thousand bits per second)
- 1,000,000 bps = 1 Mbps (one megabit or one million bits per second)
- 1,000,000,000 bps = 1 Gbps (one gigabit or one billion bits per second)
The first approch was to take the numeric value and convert it as a string using R. This is a basic implementation:
# stringr and dplyr are loaded

set.seed(24323)
v = as.integer(runif(5, min = 10, max = 2000000))
v = c(0, 1, v) # add special cases such as 0bps, 1bps
log_base = 1000 # could be 1024 if the values need to be expressed in KB, MB, etc.

raw_base = if_else(v == 0, as.numeric(NA), trunc(log(v)/log(log_base)))
base = if_else(raw_base > 5, 5, raw_base) # we go up to PETA

adjusted_value = if_else(is.na(base), v, v / log_base ^ base)
unit_prefix = dplyr::case_when(
  base == 0 | is.na(base) ~ "",
  base == 1 ~ "k",
  base == 2 ~ "M",
  base == 3 ~ "G",
  base == 4 ~ "T",
  base == 5 ~ "P",
  T ~ "ERROR"
)

unit = str_c(unit_prefix, "bps")
adjusted_value_rounded = round(adjusted_value, 2) # two-digits maximum (enable to round to value above)

output = case_when(
  adjusted_value == 0 ~ str_c('0.00 ', unit),
  adjusted_value_rounded == 0 ~ str_c('< 0.01 ', unit),
  T ~ str_trim(str_c(format(adjusted_value_rounded, big.mark=',', digits=2), ' ', unit))
)
The underlying values (variable v) are as follows:
## [1] 0 1 1541474 1479601 875475 989313 92589The converted values (variable output) are as follows:
## [1] "0.00 bps"   "1.0 bps"    "1.5 Mbps"   "1.5 Mbps"   "875.5 kbps"
## [6] "989.3 kbps" "92.6 kbps"
The data are then combined in a data frame:
dataframe = tbl_df(data.frame(
  consumption_raw = v,
  consumption_formatted = output,
  stringsAsFactors = F
))
When the data frame is rendered with DT with the formatted bandwidth pre-sorted, the ordering is done on the character values. So 980kbps will appear above 1.5Mpbs despite representing a smaller amount.
dataframe %>%
  DT::datatable(options = list(order = list(list(2, 'desc'))))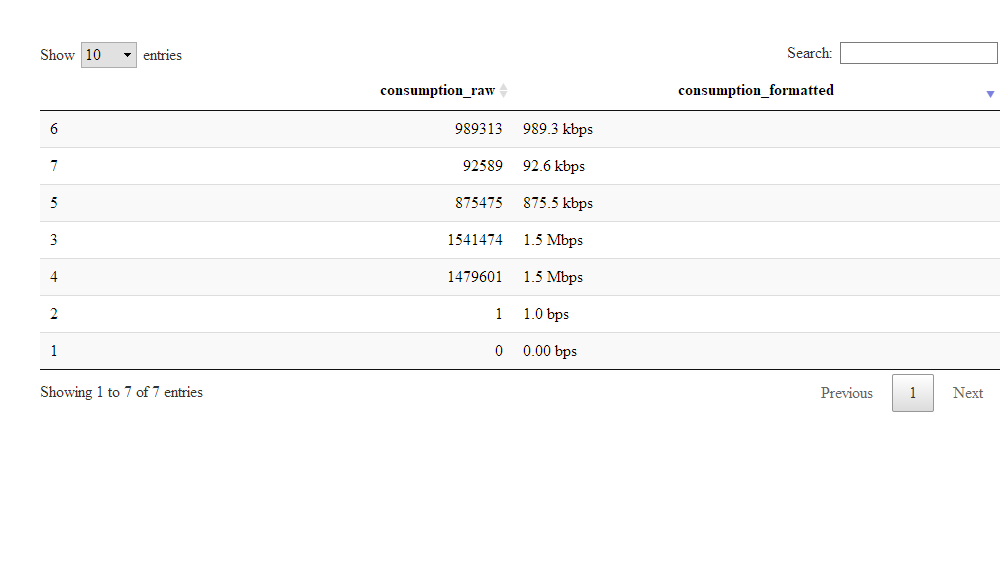
One way to fix it would be to sort the dataframe in R and disable sorting with DT. This approach could be frustrating for the users if the table is being viewed through Shiny.
 dataframe %>%
  arrange(desc(consumption_raw)) %>%
  DT::datatable(options = list(ordering=F))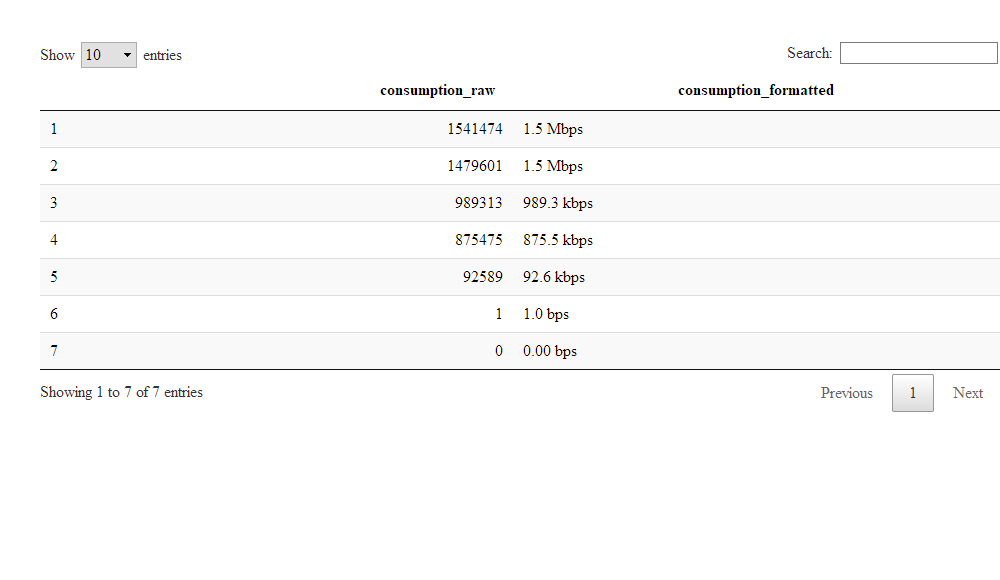
We could use column rendering, where the raw values will be passed to the datatable and the conversion will be done in javascript. In this approach, we are basically replicating the formatting code done in R for javascript (code inspired by the following gist.
dataframe %>%
datatable(options = list(
  order = list(list(1, 'desc')),
  columnDefs = list(list(
  targets = 1,
  render = JS(
    "function(data, type, row, meta) {
         if (type != 'display') {
            return data;
         }
         var sizes = ['bps', 'kbps', 'Mbps', 'Gbps', 'Tbps'];
         if (data == 0) return '0';
         var base = parseInt(Math.floor(Math.log(data) / Math.log(1000)));
         return (data / Math.pow(1000, base)).toFixed(1) + ' ' + sizes[base];
    }")
))))
This apprach has some drawbacks:
- javacript needs to be used. Implementing JavaScript functions for people coding in R may take some times.
- Code may be duplicated as the R implementation still needs to be required (for example, if I want to include )
Another approach would be do pass to DT two values within a cell:
- the underlying raw value (an integer)
- the formatted value regarding the bandwidth consumption
-
the pair can be separated by a special character such as * *,
The underlying raw value is used for sorting, while the formatted value will be used for display.
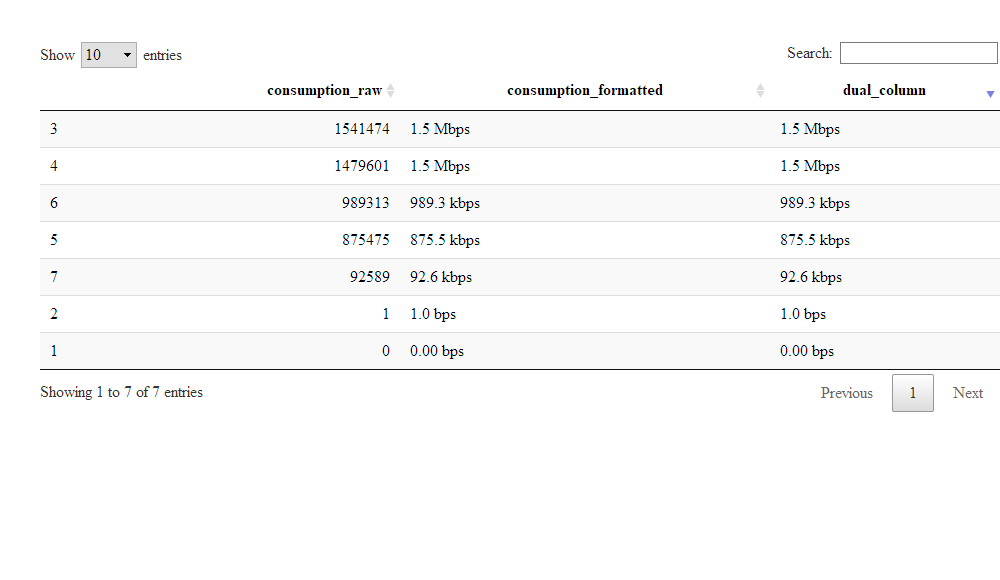
dataframe %>%
  mutate(
     dual_column = str_c(consumption_raw, "|", consumption_formatted)
   ) %>%
  datatable(options = list(
    order = list(list(3, 'desc')),
    columnDefs = list(list(
    targets = 3,
    render = JS(
      "function(data, type, row, meta) {
          split = data.split('|')
          if (type == 'display' || type == 'filter') {
            return split[1];
          } else {
            return split[0];
          }
      }")
  ))))
The trick here is to use the different values of the type parameter of the column rendering. Based on the documentation, the value can be:
filter. This is being used by the search box. In the implementation below, the value being searched is the same as being displayed.display. Here, we used the second component of the string as the displayed value.typesort. Here, we used the first componen
This approach is purely client-side. When the datatable is included in Rmarkdown document or is generated by Shiny with the server-side disabled, it will work.
But when the datatable is generated using Shiny such as:
 output$table = DT::renderDataTable({
    DT::datatable(dataframe)
  }, server = T)
it will not work. When looking at the implementation, the filtering and the sorting is done in R. As you can see, when sorting an integer converted in string, R will consider that the value "10" is lower than the value "2".
v = as.character(c(1, 2, 10, 20))
sort(v)
## [1] "1" "10" "2" "20"One way to fix it is adjust the first value of the pair by padding it with zero. It works well only for integer value. If you deal with numeric values, you need to make sure that all the numbers have the same number of characters to the left and to the right of the digit.
v.adj = str_pad(v, width = max(str_length(v)), side = "left", pad = "0")
sort(v.adj)
## [1] "01" "02" "10" "20"The following adjusted code should now work in a shiny-based environment:
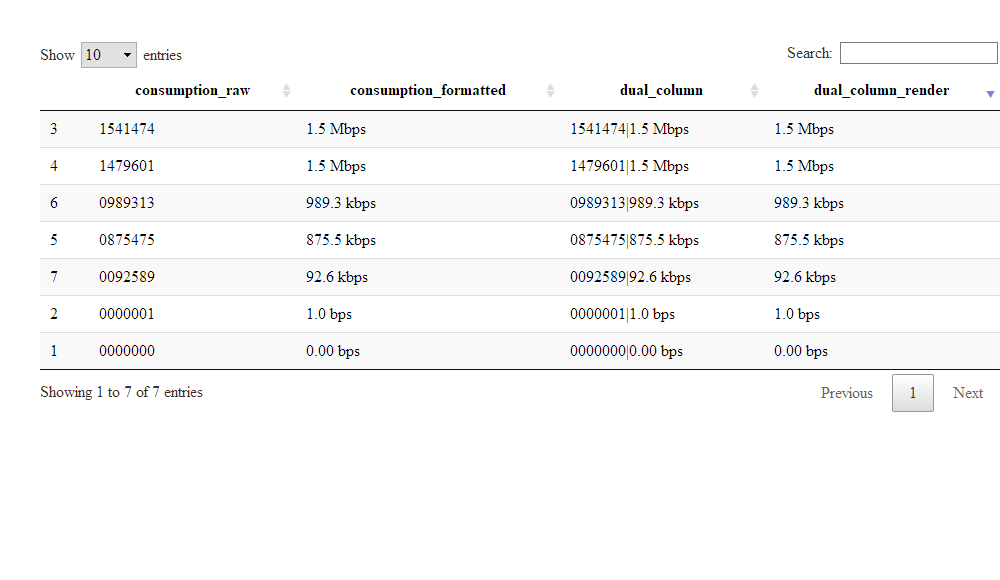
padding_left = max(str_length(dataframe$consumption_raw))


dataframe %>%
   mutate(
     consumption_raw = str_pad(consumption_raw, width = padding_left, side = "left", pad = "0"),
     dual_column = str_c(consumption_raw, "|", consumption_formatted),
     dual_column_render = dual_column
   ) %>%
select(
  consumption_raw, consumption_formatted, dual_column, dual_column_render
) %>%
datatable(options = list(
  order = list(list(4, 'desc')),
  columnDefs = list(list(
  targets = 4,
  render = JS(
    "function(data, type, row, meta) {
        split = data.split('|')
        if (type == 'display') {
          return split[1];
        } else {
          return split[0];
        }
    }")
))))